ChatGPT + Code Interpreter can now ingest data, analysis it, offer insights and graph the results.
The Code Interpreter can generate AND RUN python code to get results.
Let’s give it a go!
I asked my ‘AI Powered Data Scientist’ to ‘Analyse at all my tweets, determine the TOPICS using ML techniques and show me which of my content topics people appreciate the most’
▶️ 1. Get your X / twitter archive data.
Download your X / twitter archive. Settings -> Your Account -> Download and archive of your data.
This can take over 24 hours. You’ll get an email with a link when it’s ready to download.
▶️ 2. Upload the file to ChatGPT
Find the javascript file data/src/tweets.js that has an array called window.YTD.tweets.part0 and upload that.
This file contains an export of all my tweets. Each object in the array is a tweet or a retweet.
▶️ 3. ChatGPT ingests and analysis the schema.
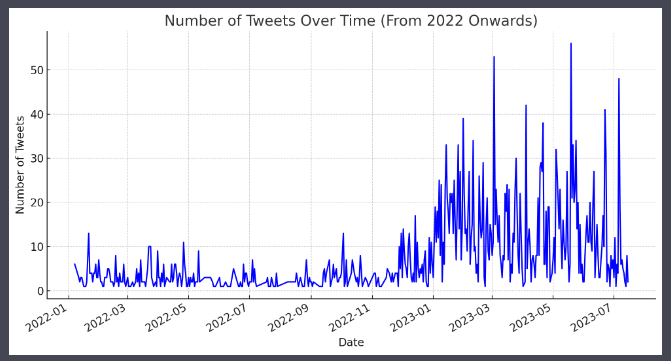
▶️ 4. Now let’s try something simple. Ask ChatGPT for a time-series graph of my tweets per day.
“Can you show me a timeseries graph of my tweets in the last 2 year. Date on the x axis and number of tweets on the y axis.”
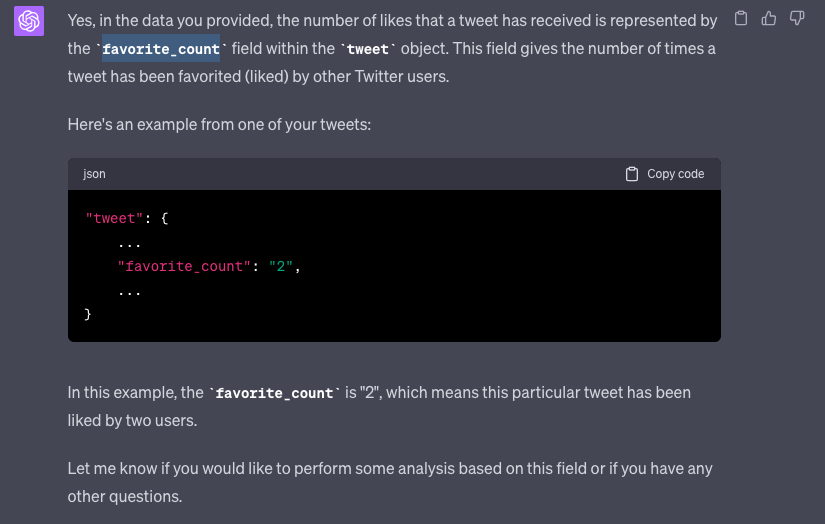
▶️ 5. Liked Tweets?
Interesting though the X / twitter archive data does not contains a ‘likes’ field.
But ChatGPT figured out the correct field was favorite_count all by it self.
Unfortunately no comments and retweets in the archive.
▶️ 6. “Can you look at all my tweets since 2022 and look at the content. Determine what are my main topics. Finally show me a bubble graph of my main topics.”
NOTE: I made a mistake here asking for a bubble chart. I was of course looking for a pie chart. More below.
▶️ 7. ChatGPT gets to work and describes step-by-step it’s process.
It decides to between several techniques and settles on the Latent Dirichlet Allocation (LDA) method to identify topics and to use likes for popularity.
What is LDA? ChatGPT helpfully describes it.
My AI Data Scientist determined the following topics though analysing my tweets:
1. Startup Discussion
2. AI & Coding
3. Positive AI Remarks
4. Product Development
5. Content Appreciation
▶️ 8. “Show me a graph”. My AI Data Scientist patiently explained that I didn’t have the dimensions for a bubble chart. It tells me what I really wanted was a pie chart. Of course.
Impressive indeed! But of course this does not replace a Data Scientist and while the python code is available to inspect and try for yourself, I have not run the code to validate the results. I’m trusting the AI 👀
What have you tried so far with ChatGPT + Code Interpreter?